
When you are in the landscape lighting industry as a manufacturer, lighting designer, distributor, or architect specifier, you will often need to reference IES photometric plan files to understand the true output of light and lumen power for the fixtures you wish to install into your designs. For all of us in the outdoor lighting industry, this article is here to help us better understand how to read and analyze photometric lighting diagrams.
As stated by Wikipedia in the simplest terms as a reference to understanding optics; Photometry Is the science of the measurement of light. A photometric analysis report is really the fingerprint of how a luminaire light fixture delivers its light for that unique product design. In order to measure all of the light output angles and at what intensity (also called its candela or candle power), noting the analysis of a luminaire that delivers light, we use something called a Mirror Goniometer to help us identify these varied aspects of light being output in strength and distance relative to its patterns. This instrument takes light intensity (candela) and measures it at different angles. The distance from the lamp to the Goniometer has to be 25 feet or better to get a correct measure of the candela (intensity). For the IES photometric analysis to work properly, we start by measuring the candelas or candle power at 0 degrees (zero being below the lamp or the bottom). Then we move the goniometer 5 degrees and continue to move it again and again, another 5 degrees more each time all the way around the luminaire to properly read the light output.
HOW TO UNDERSTAND THE PHOTOMETRIC LIGHT OUTPUT MEASUREMENT PROCESS
Once, having gone all the way around 360 degrees, we move the goniometer and start at a 45-degree angle from where we began and repeat the process. Depending on the landscape light fixture, we may do this at various different angles to properly capture the true lumen outputs. A candela chart, or candle power curve, is made from that information and utilized for creating these IES Photometric files we use in the lighting industry. At each different angle of light, we will see the different intensity of the luminaire which is often unique among lighting manufacturers. A light distribution model is then created, also called a candle power curve, which in turn provides lighting designers and architects with a visual representation of the light being diffused by a luminaire through its optics, shrouds, and shapes.
The farther away we get from the zero point of measure, the more intense the light output is. A candela distribution table is the candela curve but put in the tabular form.
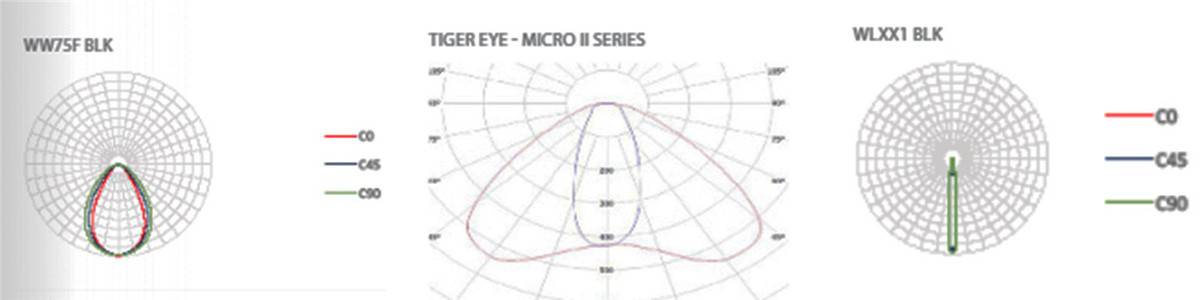
The photometric light diagrams created from these findings tell you immediately if most of the flux (the lumens, the “flow of light”) goes upwards downwards or sideways.
The coefficient utilization table in photometry considers the percentage of light from the lamps that reach the work surface in a given space. The room cavity ratio is the ratio of walls to horizontal surfaces or floors to the work area. Walls absorb a lot of light. The more they absorb, the less light gets to the areas where the light is being cast upon. We also have reflectance values on these charts which consider the percentages of reflection from floors, walls, and ceilings. If the walls are of a dark wood that doesn’t reflect light well, that will mean that less light is being reflected on to our work surface.
Understanding how all of this light output works for each product, allows the lighting designer to accurately plan the height at which to place a lamp and the distance between the lamps to properly illuminate the outdoor spaces to fill that space with evenly distributed light. With all this information, photometric planning and analysis will allow you (or software) to easily select the right amount of luminaires required for the most beneficial lighting design project plan by factoring in the appropriate wattage power and lumen output levels to create that optimal lighting coverage using the specifications which illustrate the degrees of light angles that each light will display on the architects blueprints for the property. These methods for determining the best landscape lighting designs and installation plans, allow the professionals and large construction project purchasing managers to properly control and understand which lights are best to install into a given area on the property blueprint from the architects, based on the light distribution curves and lumens output data.
INDUSTRY PHOTOMETRIC PLAN LIGHTING IES DIAGRAM CHART TERMS

Lumens: Luminous flux, measured in lumens (lm), is the total amount of light produced by a source without regard to direction. The luminous flux is provided by lamp manufacturers and common lumen values are included in the lamp matrix.
Candela: Luminous intensity also referred to as Brightness, measured in candela (cd), is the amount of light produced in a specific direction. Graphically, this information is compiled into polar formatted charts that indicate the intensity of light at each angle away from 0 ̊ lamp axis (nadir). The numeric information is also available in tabular form.
Footcandles: Illuminance, measured in footcandles (fc), is the measure of the quantity of light that arrives on a surface. Three factors that affect illuminance are the intensity of the luminaire in the direction of the surface, the distance from the luminaire to the surface, and the angle of incidence of the arriving light. Although illuminance cannot be detected by our eyes, it is a common criterion used in specifying designs.
Please note: Footcandles are the most common unit of measure used by lighting professionals to calculate light levels in businesses and outdoor spaces. A footcandle is defined as the illuminance on a one square foot surface from a uniform source of light. The Illuminating Engineering Society (IES) recommends the following lighting standards and footcandle levels to ensure adequate illumination and safety for occupants.
Candelas/meter: Luminance measured in candelas/meter is the quantity of light that leaves a surface. It is what the eye perceives. Luminance will reveal more about the quality and comfort of a design than illuminance alone.
Center Beam Candle Power (CBCP): Center beam candlepower is the luminous intensity at the center of a beam, expressed in candelas (cd).
Cone of Light: Useful tools for rapid lighting comparisons and calculations, cones of light calculate initial footcandle levels for a single unit based upon point calculation techniques. Beam diameters are rounded to the nearest half-foot.
Downlight: These cones of light provide single-unit performance with no inter-reflections from surfaces. Data listed is for mounting height, footcandle values at nadir, and resulting beam diameter.
Accent Lighting: Patterns of light from adjustable accent luminaires are dependent upon the lamp type, wattage, lamp tilt and location of the illuminated plane. Single-unit performance data is provided for horizontal and vertical planes, with the lamp tilted at either 0 ̊, 30 ̊, or 45 ̊ aiming.
Beam Light Aiming: Beam light aiming diagrams allow a designer to easily select the proper distance from a wall to locate a luminaire and get the center beam of the lamp where desired. For lighting art objects on a wall, the 30 ̊ aiming is preferred. At this angle, 1/3 of the beam’s length will be above the CB point, and 2/3 will be below it. Thus, if a painting is three feet tall, plan for the CB to be aimed 1 foot below the top of the painting. For increased modeling of three-dimensional objects, two lights are typically used, a key light and fill light. Both are aimed at least 30 ̊ elevation and are located 45 ̊ off axis.
Wall Wash Lighting Data: Asymmetric wall wash distributions are provided with two types of performance charts. A single-unit performance chart plots the illuminance levels at one-foot increments along and down a wall. Multiple-unit performance charts report the performance of the middle units computed from a four-unit layout. Illuminance values are plotted centerline of a unit and centered between units.1. Illuminance values are cosine-corrected initial values.2. No room surface inter-reflections contribute to illuminance values.3. Changing unit spacing will affect the illumination level.
THE TRUE POWER OF LANDSCAPE LIGHTING PRODUCTS VARIES
Understanding how light is properly measured and analyzed is always important in the outdoor landscape lighting industry. When using lights for large projects, we must also plan far ahead and understand that we are properly designing our lighting plans to help us know far ahead of time, what lights we will install where, and how many we will install at certain distances to get the proper light coverage. This is why at Garden Light LED our hats go off to the lighting labs, IES engineers and the Intertek standards for low voltage lighting fixtures that aim to provide our industry with true readings for high-quality light measurements and giving us data that professionals can utilize to create more efficient lighting designs while making smarter buying decisions.
If you are shopping for outdoor landscape lights, we always recommend watching out for many of the other resellers pretending to be manufacturers stating high lumen outputs at low costs, because in our facility photometric tests, these other light fixtures from many other low voltage landscape lighting brands in the USA and abroad, are falling very short of their reported specifications and power demands light output claims with their cheap imported products.
When you’re looking for the best landscape lights out there, we welcome you to contact us and we’ll be happy to put one of our professional-grade led lights in your hands to conduct a real-world comparison!
Post time: Jan-08-2021